
To optimize a global infrastructure, you need granular data on who is consuming your content. The Translation Requests dashboard acts as your central telemetry unit. It tracks every instance where the MultiLipi engine serves a translated page, aggregating this data into time-series visualizations. This allows you to distinguish between passive languages (enabled but unused) and active markets (high consumption), validating your localization ROI.
This guide details the navigation and interpretation of your linguistic traffic data.
2. The Dashboard Architecture
Understanding the signals.
A. Total Translation Requests (The Aggregate Load)
Display: A large numerical indicator at the top of the panel.
Definition: This represents the total number of "Translation Calls" made to our API across all languages.
Technical Note: A call is triggered whenever a visitor loads a page in a target language (via LiveJS, Sub-directory, or Sub-domain). It is a direct proxy for "Localized Page Views."
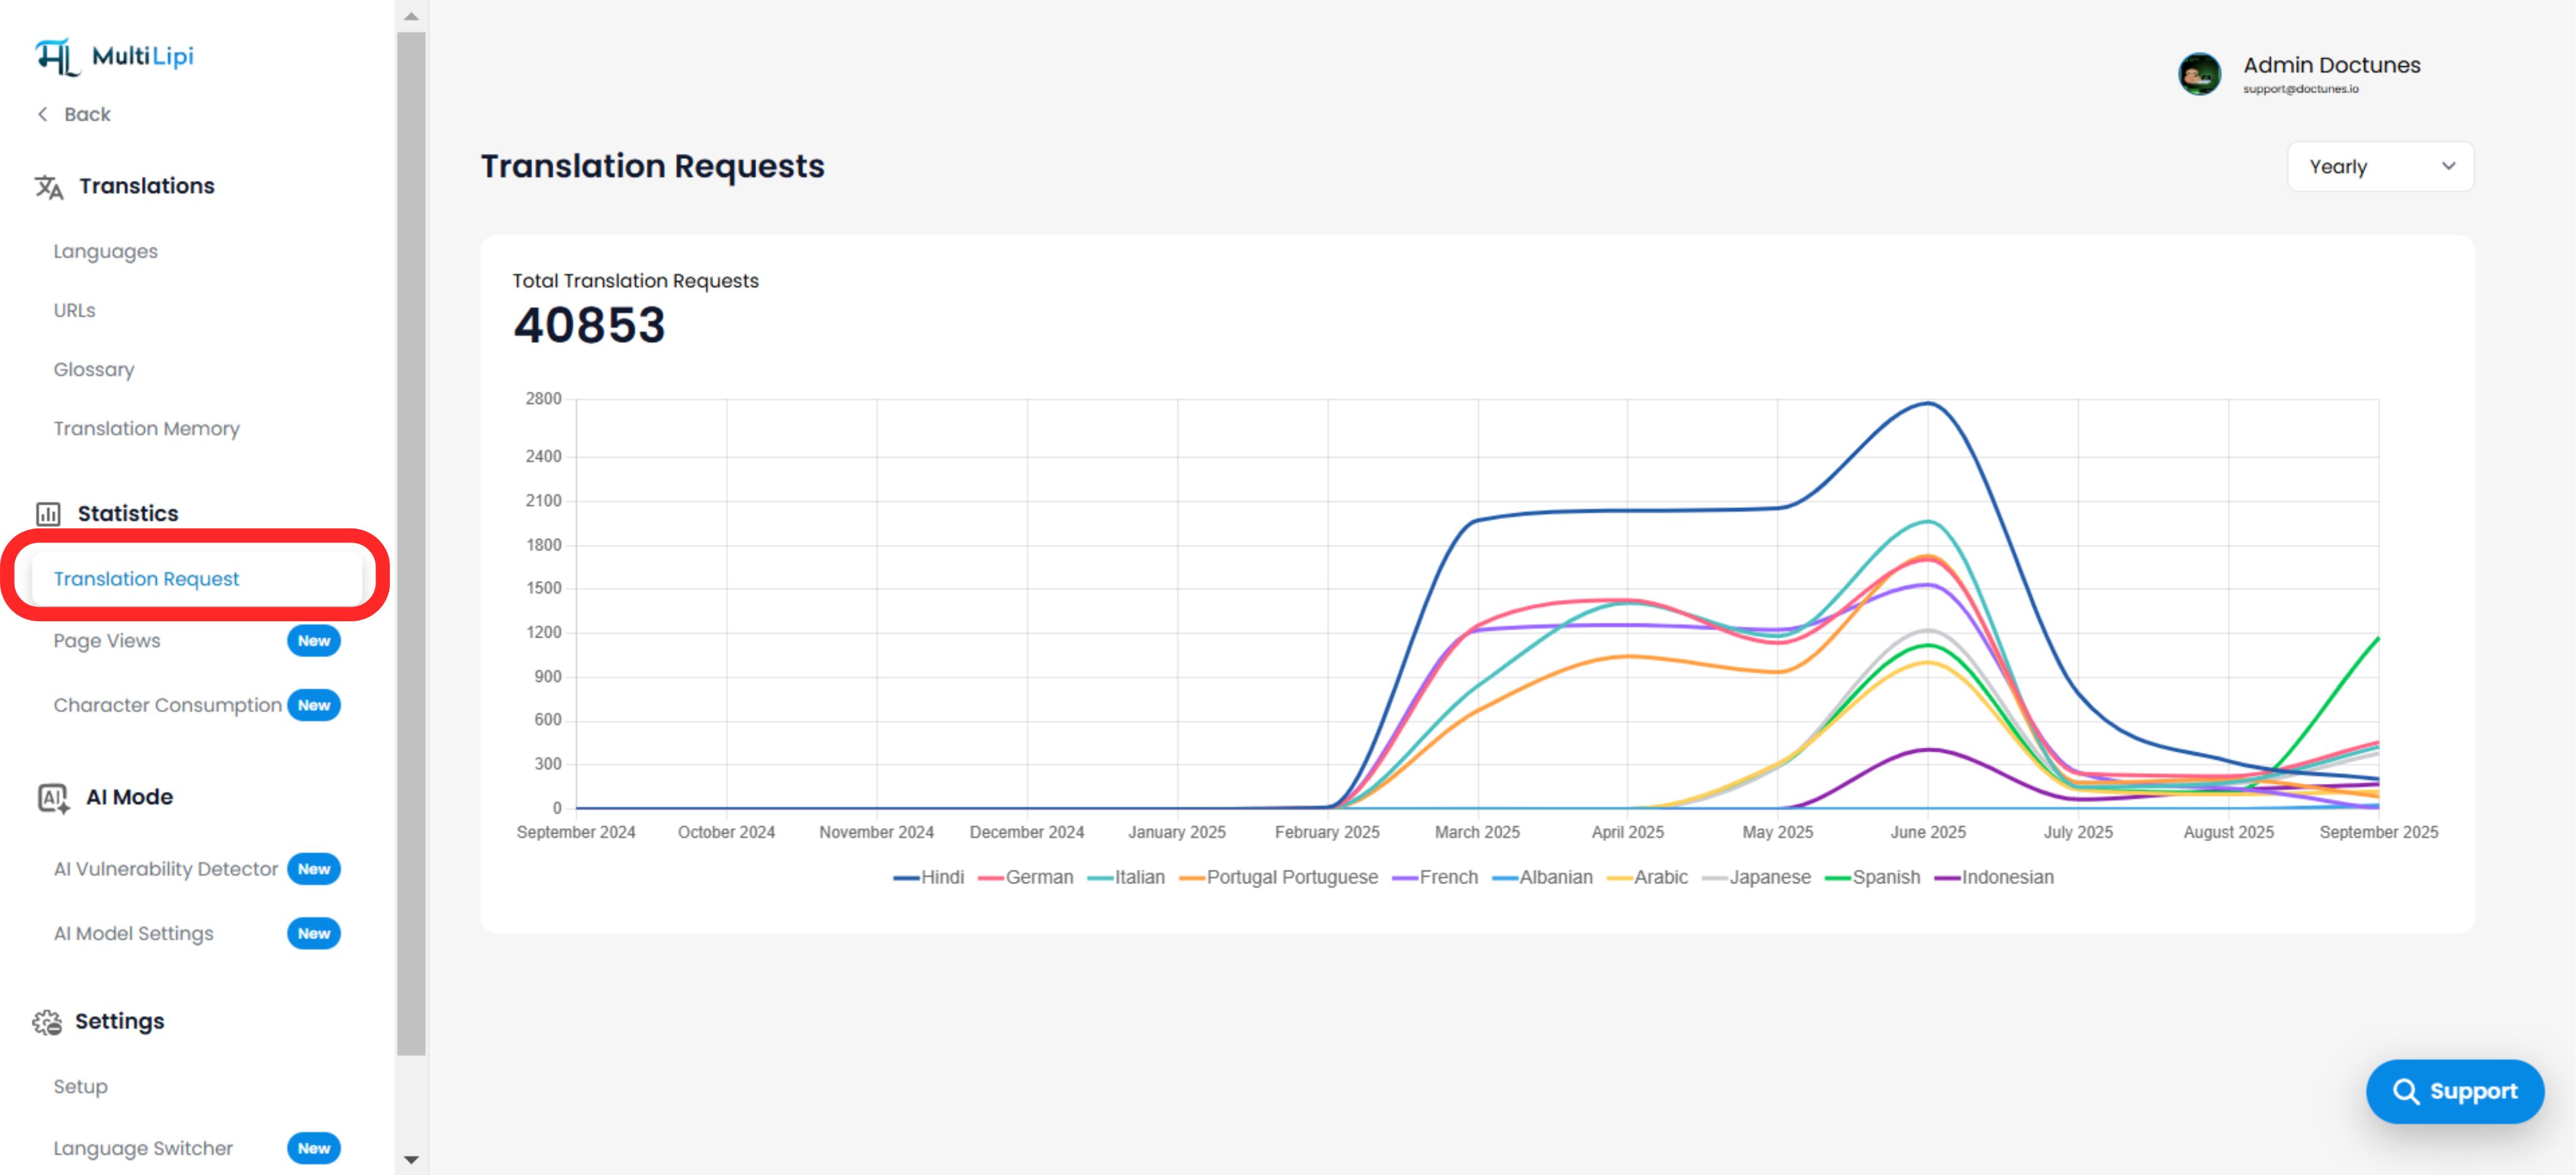
B. Language-Wise Time Series (The Trend Graph)
Visualization: A multi-colored line graph tracking performance over time.
Y-Axis (Volume): Number of requests/views.
X-Axis (Time): Timeline (Months/Weeks).
Legend: Each color represents a distinct language (e.g., Hindi = Blue, Spanish = Red).
Insight: This visualization reveals volatility and growth. A flat line indicates stagnation; a spike indicates a successful campaign or viral event in that region.
3. Granularity Controls (Time Filters)
Zooming into the data.
You can adjust the resolution of the data using the filter dropdown in the top-right corner:
| Filter | Use Case |
|---|---|
| Daily | Debugging: Did traffic drop to zero yesterday? (Potential DNS issue). |
| Weekly | Campaign Tracking: Tracking the immediate impact of a new localized ad. |
| Monthly | Performance Reporting: High-level reporting for stakeholders. |
| Yearly | Seasonality: Identifying long-term trends (e.g., German traffic peaks in December). |
4. Strategic Intelligence
Turning data into decisions.
Market Validation
If you see Spanish traffic spiking significantly in September 2025, it validates that your Spanish localization is driving real value. You might prioritize adding more content for this region.
Resource Allocation
If German has zero requests for six months, you might consider deprecating it or investigating if the language switcher is broken for German users.
SEO Monitoring
A sudden, sustained rise in a specific language often indicates that Google has started indexing your translated sub-directories (e.g., /hi/) for that region.