Understanding the “Page Views” Dashboard in MultiLipi
 MultiLipi
•
Sep. 16, 2025
•
5 Min read
MultiLipi
•
Sep. 16, 2025
•
5 Min read
MultiLipi offers a powerful analytics section to help you track multilingual SEO performance. The Page Views tab provides in-depth insights into how users interact with your translated website — showing where your traffic is coming from, which languages are used, and how different devices and browsers are being used to access your content.
Let’s break down each part of the dashboard so you can make the most of this data:
Where to Find Translation Request Stats
Just follow these simple steps to access your stats:
- Login to your MultiLipi Dashboard
- Navigate to the left panel and click on Projects
- Choose the project/website you want to analyze
Click on Statistics → Page Views in the sidebar
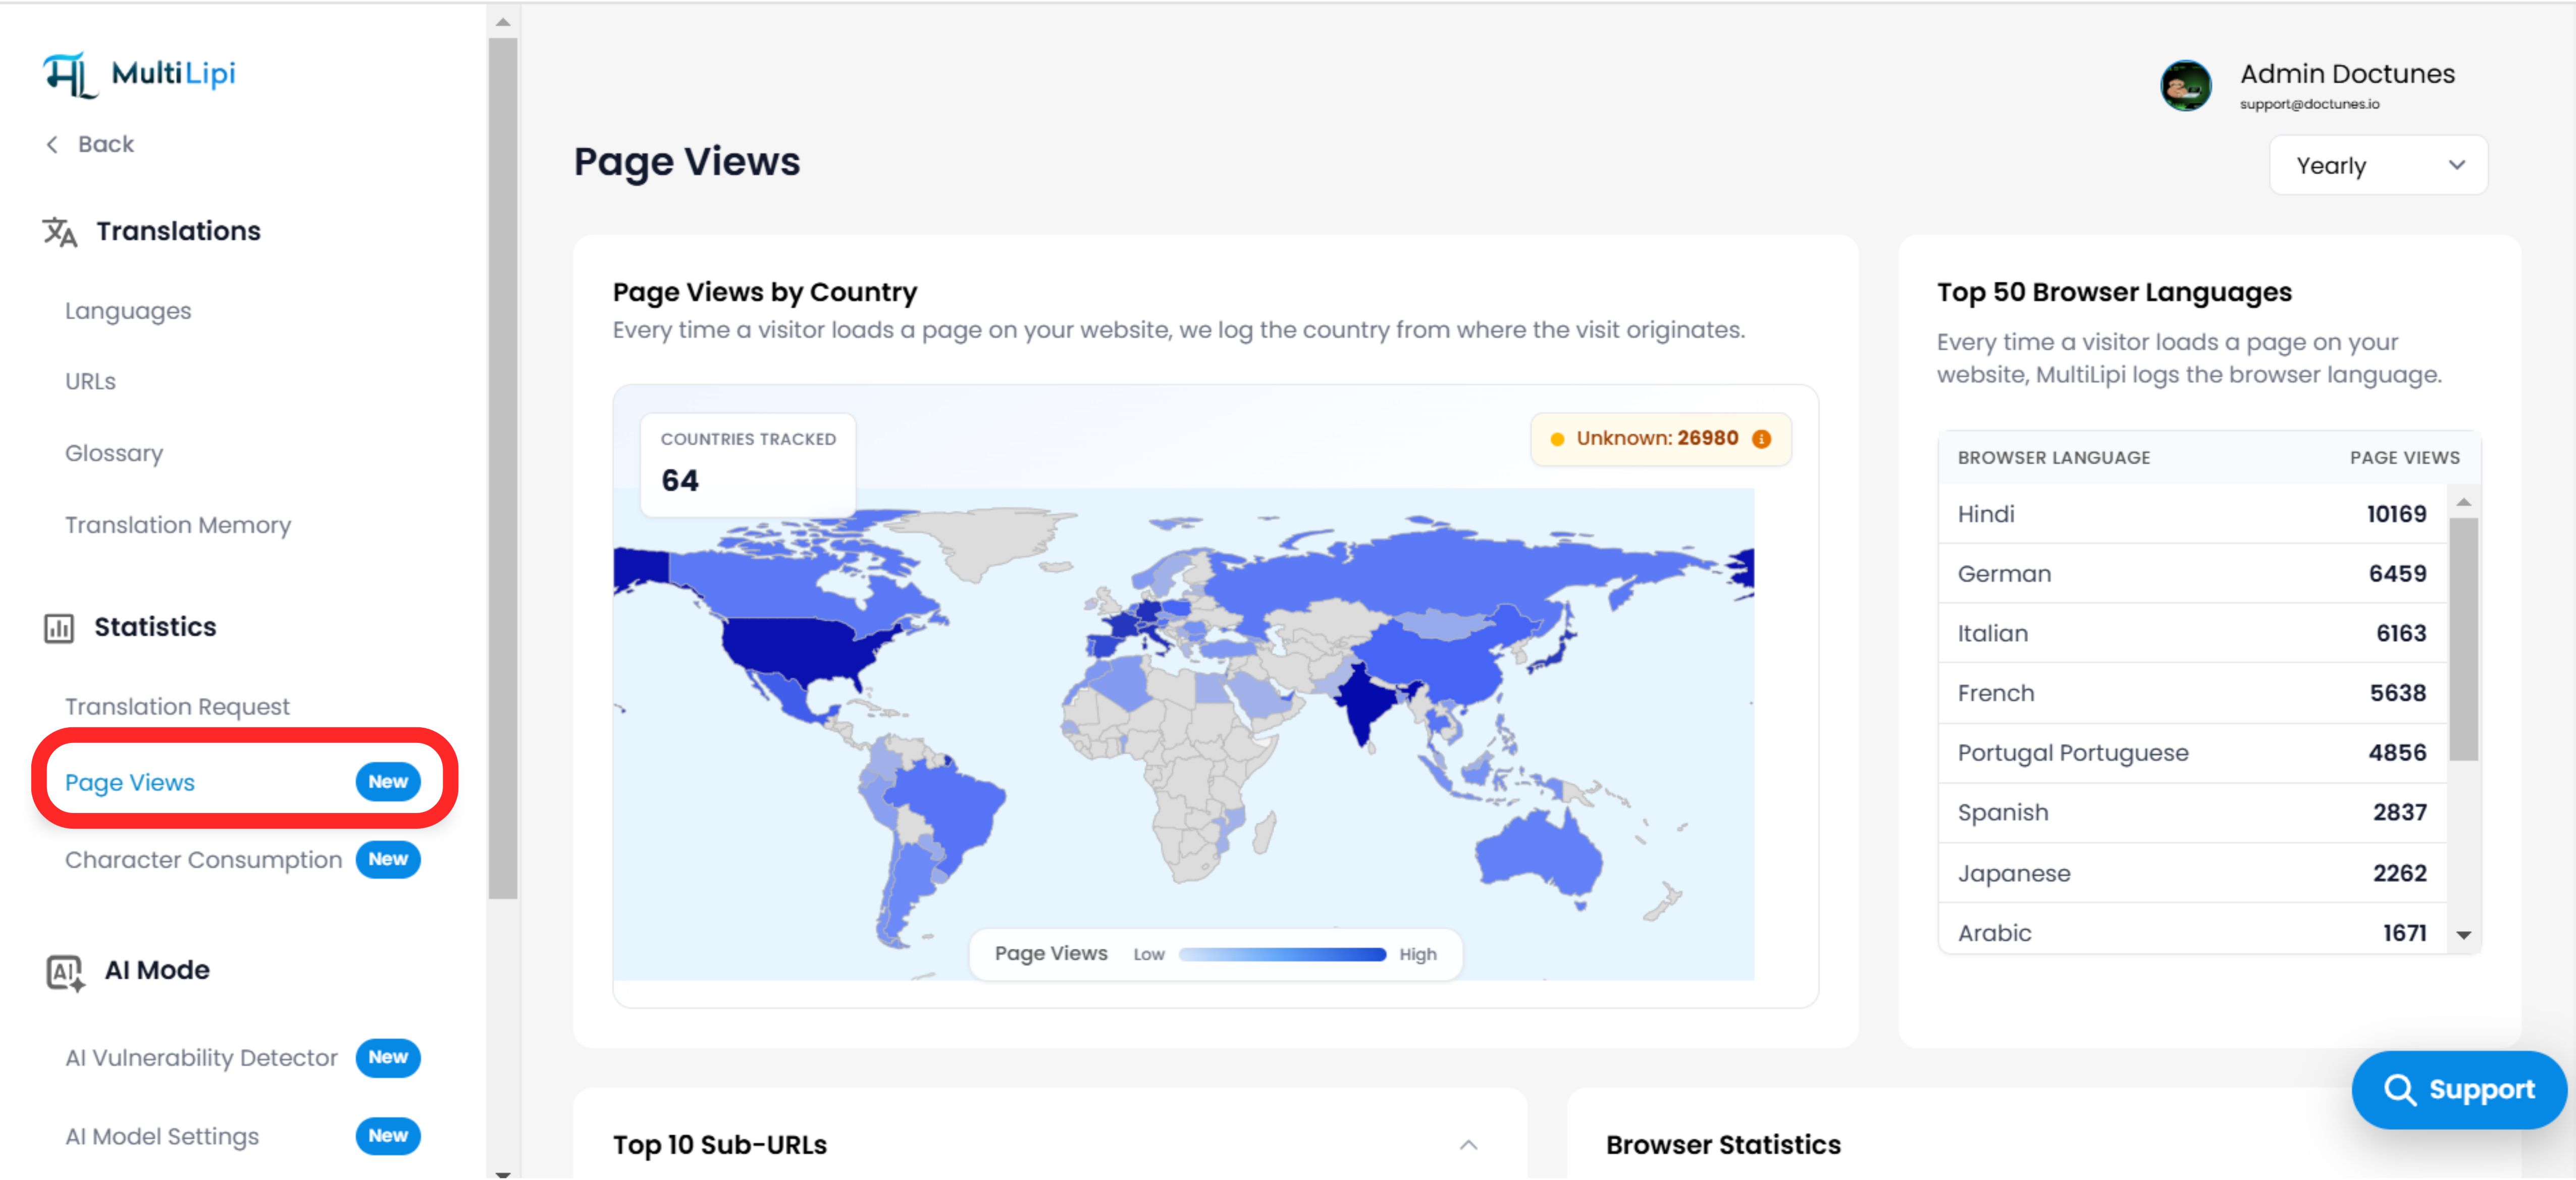
Page Views by Country
What it shows:
- A world map visual that highlights the number of page views from different countries.
- The map gives a color-coded indication of low-to-high page views.
- A badge at the top right shows the number of "Unknown" traffic sources that couldn’t be geolocated.
- Total number of countries tracked is shown at the top left.
How it helps:
- Helps you identify your top-performing countries.
- Reveals potential new markets where users are visiting from, even if not yet localized.
- Essential for prioritizing future translations or campaigns based on geographical interest.
Top 50 Browser Languages
What it shows:
- A ranked list of the top 50 browser languages detected when users visit your site.
- Example: Hindi, German, Italian, French, etc.
How it helps:
- Gives you insights into which languages are most common among your visitors.
- Useful for validating your language selection strategy.
- Can guide you to add more language options based on actual visitor demand.

Top 10 Sub-URLs
What it shows:
- The most frequently visited translated pages (paths) on your website.
- Example entries might include /, /pricing, /blog/article/multilipi-2_0-features, etc.
How it helps:
- Lets you understand which pages attract the most global traffic.
- Helps assess the impact of multilingual SEO on different parts of your site.
- Can identify pages that may need manual translation enhancement or optimization.
Browser Statistics
What it shows:
- A bar graph breakdown of how many visitors use each browser.
- Chrome, Firefox, Safari, Edge, Opera, and others are tracked.
How it helps:
- Useful for debugging frontend translation visibility on specific browsers.
- Can help prioritize browser-specific testing for your translated pages.
Device Traffic
What it shows:
- A donut chart displaying the percentage of traffic from:
- Desktop
- Mobile
- Tablet
How it helps:
- Critical for understanding how users interact with your site on different devices.
- Guides decisions around responsive design and mobile performance optimization.
- Helps you identify device trends in different regions or languages.
Filtering by Date (Yearly/Monthly/Weekly)
Use the dropdown in the top-right corner to filter stats by time range. This allows you to:
- Track growth trends over time
- Compare the effectiveness of campaigns
- Focus on recent vs long-term user behavior
Pro Tips
- Use this data in combination with your Translation Requests and Character Consumption stats to correlate traffic with translation activity.
- Look at countries and browser languages together to identify high-priority locales for localization.
- Use the Top URLs insight to find landing pages you can further enhance with glossary rules, human review, or improved UI.
Comments